As the degree of automation in power plants increases, it is also important to improve the operational efficiency and maintainability of critical equipment. The traditional equipment maintenance methods have increasingly exposed their limitations, and the economic losses caused by equipment failures are increasingly being valued and paid attention by power generation companies. Based on the analysis of the safety status of generator set equipment, based on the rich fault and early warning model of expert case database, combined with IO configuration, high-speed data communication and other information technology, the design and implementation of online monitoring and fault early warning system for power plant equipment are elaborated. . The application of the system can alarm the equipment failure in advance, ensure the safe and stable operation of the equipment, effectively reduce the incidence of equipment failure, and greatly improve the management efficiency of the unit equipment.
0 Preface
Any failure of the power plant production process not only directly affects the power production and power quality, but also may cause equipment damage and personal accidents. In order to make the genset equipment safe, reliable and effective, and to make full use of it, the development of equipment condition monitoring and fault warning technology is the only way. The basic idea of ​​the fault early warning technology is to monitor the running status of the equipment in real time. When the equipment fault occurs initially, that is, when the current running state of the equipment is less than the normal state, the accurate and rapid diagnosis result is given, and more efforts are made for the maintenance and operation personnel. The fault handling time and initiative improve the reliability of the unit equipment, reduce maintenance costs and reduce economic losses. The online monitoring and fault warning system for power plant equipment, an intelligent analysis system designed and developed for important equipment in the power generation generator set, provides an overall solution for equipment monitoring, early warning, overhaul and auxiliary decision making of the generator set.
1, system architecture design
1.1, physical architecture
The physical structure of the plant equipment condition monitoring and fault warning system is shown in Figure 1. The physical architecture of the system builds an application architecture from real-time data collection to application layer data processing to multi-platform information display, forming a complete, high-speed, and secure environmental system to achieve real-time monitoring and early warning of power plant equipment.
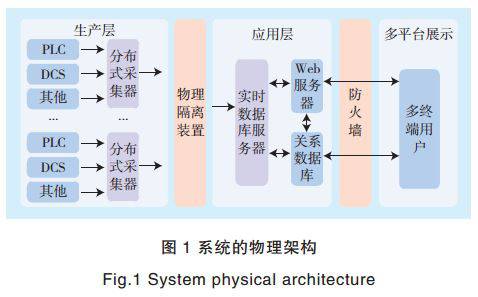
1) Production layer: It includes multiple systems such as Distributed Control System (DCS) and Programmable Logical Controller (PLC). Data is collected from these systems through distributed collectors. The data is sent to the application layer. The production layer and the application layer are connected by physical isolation devices, so that the collected data can only flow from the production layer to the application layer in one direction, thereby ensuring efficient, safe and stable transmission of real-time data.
2) Application layer: It includes a series of devices such as real-time library server, web server, database server, file server and interface server. The real-time library server obtains real-time data from the production level, and divides and archives the data. The processed data is transmitted to the web server via the internal network and sent by the web server to the information presentation layer of the multi-platform.
3) Multi-platform information display layer: In this layer system, through the Web server, the latest device operation information is pushed to multiple platforms such as PC and mobile phone. Users can keep track of the running status of the device and check for possible failures. Safe, efficient and stable production of power plants reduces economic losses.
1.2, data architecture
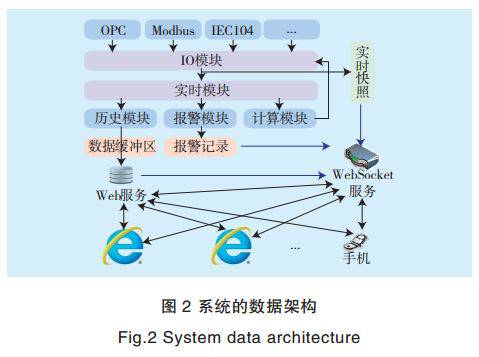
According to the data type, the system can be divided into the raw data collected from the device in real time, the device measuring point information maintained in the Web system, the configured indicator working condition fault information, and the information in the real-time library. After the data is processed, the system can be monitored. Early warning data. As an important part of the real-time library, it supports the two main functions of system condition monitoring and fault warning. The data architecture of the system is shown in Figure 2. Through the IO module, the raw data is obtained and transmitted to the real-time module via the internal network. In this process, the real-time database retains a real-time snapshot of the original data for use by the web system. The real-time module is divided into three sub-function modules, which are history module, alarm module and calculation module.
1) The system records real-time data through the history module and instantiates it for system learning and analysis of historical operating rules of each device.
2) The alarm module obtains information such as the corresponding working conditions of each device according to the parameters of the device measuring points maintained in the Web system, and then generates an alarm record by calculating and analyzing the real-time data.
3) The calculation module obtains the real-time snapshot, historical data and alarm data provided by the real-time database through the WebSocket service of the system, and then re-processes it through the Web system, and presents it to the user in the form of reports, forms, graphics, message reminders, and the like.
1.3, technical architecture
The technical architecture of the system is shown in Figure 3. The bottom-up system is divided into an acquisition layer, a storage layer, an application layer, a service layer, and a presentation layer. The division of labor at each level is clear, and data transmission is carried out by a mixed mode of internal and external networks.
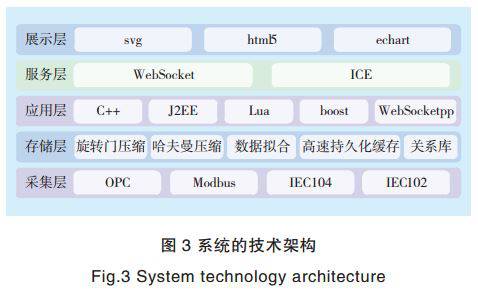
1) Acquisition layer: Responsible for system data collection, is the data source of the system.
2) Storage layer: Responsible for data compression, storage, retrieval and query, providing data support for the core functional layer.
3) Application layer: It is used to build the software application environment, responsible for the underlying technical support, and closely related to the hardware service layer, so that the subsystem services can run normally.
4) Service layer: Providing data or information push to the client or third-party system is a key part of the system, obtaining data from the storage layer, and converting the aggregated data into visualization through a series of operations such as algorithms and formulas in the system. Information is pushed to each platform for display.
5) Display layer: Provides a variety of display methods of system information, including the display of data on the PC side and mobile side.
2, the system key technology
The online monitoring and fault warning system of the equipment is divided into two parts: online monitoring and fault warning. The most important thing about online monitoring is the real-time nature of the data, that is, the user can understand the real-time production situation at the first time and realize the high-speed processing of the real-time data stream. The most important aspect of fault warning is the accuracy of the warning. Accurate fault warning can reduce the occurrence of accidents and reduce the downtime of the unit. The accuracy of the warning depends on the accuracy of the expert library and the calculation process. The design and development of the entire system is centered around the online monitoring and failure warning.
The core of the information system is data. For this system, all functions are based on real-time data. The main data processing part of the system is completed by the Iplant real-time database independently developed by Keda Guochuang. The Iplant real-time database is responsible for data collection, storage, analysis, calculation, alarming, and data push to clients and third-party systems. The real-time database provides data support for various upper-layer applications and is the basis for system operation.
2.1, IO configuration
The IO configuration module is the acquisition module of the real-time database and is the data source of the entire system. The IO configuration module uses distributed data acquisition to deploy IO collectors at different network nodes, in different physical locations, and even through physical isolation devices. The IO configuration module collects data from different systems and devices and uploads them to the real-time database based on the configured communication devices and corresponding communication parameters. Different communication protocols and different communication devices adopt a unified data upload interface to completely realize the transparency of the communication protocol. The collector and real-time database are loosely coupled and can be deployed on the same machine or on different machines to enhance system deployment flexibility. The communication protocols that have been implemented in the system are: OPC, Modbus, IEC102, IEC104 and other standard communication protocols, as well as PI, pSpace, EDNA and other real-time database manufacturer APIs, supporting passive acquisition and active acquisition of two acquisition modes.
2.2, historical data management
The historical data processing module is responsible for the data storage and retrieval of the entire system, and the compression efficiency of the historical data directly affects the storage time of the file. Historical file management takes the measurement point as the core, and organizes historical data around the measurement points. The data types are divided into Float, Digital, Int4, Int2, byte and other types. The stored measurement information includes timestamp, measurement value and quality. stamp. Historical file storage uses three-level indexing, time-stamp differential storage and other technical means to improve retrieval efficiency and storage capacity, and optimize data access through recent memory access mechanisms, shorten data access time, and improve query, comparison, and calculation of historical data in the system. s efficiency.
2.3, data compression and fitting
In real-time databases, it usually has the characteristics of large data collection and high data proximity. If you do not compress this data, it will cause huge waste of system resources. Therefore, in order to save disk space, the system will use the revolving door compression, dead zone compression or Huffman compression algorithm according to the settings when storing historical data. data compression.
2.4, high-speed data communication technology
Because the system has multiple modules such as data acquisition, real-time data processing, historical data, calculation and alarm, the data communication speed between modules directly affects the real-time performance of the system and the correctness of the data. In order to ensure the real-time and correctness of the system, the communication between modules adopts a persistent memory mapping method. The advantage of this method is that the communication efficiency is high, and the data can be ensured without loss in case of abnormal power failure or abnormal program. WebSocket technology is used to transmit real-time data on the server side and the browser side. Since the transmission uses binary data block communication and maintains a constant connection, the communication efficiency is several times higher than that of the traditional http polling. The pages in the system run smoothly in the browser without delay, and the alarm information can be quickly pushed to the user in real time.
2.5, distributed technology
Due to system characteristics or hardware constraints, different functional modules may be deployed on different servers or in different physical locations. The system uses Internet Communications Engine (ICE) technology to solve communication problems between modules. ICE is a high-performance, cross-platform, cross-language middleware that supports distributed deployment management, messaging middleware, and grid computing.
The system utilizes ICE framework technology to implement the distributed functions of each module. When there are many measuring points, the data volume is very large, or the server processing capacity is insufficient, the functional modules of the real-time database can be distributed to different servers.
2.6, real-time data calculation
System monitoring and early warning relies on accurate, timely, and flexible statistical calculation processing of real-time data. The calculation module passes the formula script through lexical analysis, grammar analysis and other processes, which can realize the calculation of simple formulas, script segments and complex scripts.
Simple formulas include operators, expressions, functions, measuring points, formulas, and parentheses. Functions include common mathematical functions, IF97 water vapor functions, and custom functions, horizontal calculation functions between points, and vertical statistical functions. The simple formula can be combined with various parameters such as measurement point coding information, expression, secondary formula, four arithmetic, logical relationship, predefined mathematical formula, and custom function to form the required calculation rules.
Script segments include variable definitions, expression statements, if branches, switch branches, for loops, while loops, and more.
Complex scripts include function calls in addition to expressions and script sections. Each script has a main function as the run entry. Complex scripts can meet the needs of more flexible and powerful real-time computing.
The calculation engine in the system loads the above calculation rule. When the real-time data is received, the calculation is automatically triggered immediately, and the alarm is determined according to the calculation result and a preset rule. The calculation results can also be stored as real-time data in the real-time library, thereby avoiding recalculation during historical data playback and reducing system load.
2.7, fault information push
The fault warning relies on real-time data calculation to realize the fault warning information push function. The fault warning trigger mode is divided into a periodic trigger and a new data trigger mode, which can directly alarm for the measurement point, and can also alarm for the calculation result of the calculation formula (script). The system also takes into account the alarm situation of the measuring point under different working conditions, and can set the alarm triggering condition for different working conditions. There are many ways to trigger the alarm, such as threshold alarm, design value alarm and upper and lower limit alarm. In order to prevent sporadic data anomalies, the system eliminates data disturbances by setting duration, dead zone, etc., reducing false alarms and repeated reports.
After the alarm is generated and the end, the relevant alarm information is cached locally in the real-time database module and then sent to the web server, and the user-oriented alarm notification and display are performed by the web server.
3, the main functions of the system
3.1, device information management function
The equipment information management function is mainly used to maintain the main physical information of the generator set equipment, including the location information of the unit equipment, the maintenance information of the equipment related technical specifications (including equipment codes, manufacturers, etc.), and the basic information of the equipment measuring points. In addition, we must build an indicator system to extract and filter all the measuring points on the equipment, and select useful measuring points (such as equipment performance parameters, main indicators, etc.) closely related to the operating conditions of the equipment, and abstract them into multiple Collect point indicators. According to the calculation or logical relationship between the measurement points mined by the expert case library, the virtual measurement points are called virtual calculation points. These virtual measurement points are called the calculation point indicators, which can be used as the flag value of the health status of the equipment operation, and can also be easily understood by the management personnel. Some operational reference data that is visualized. These collection points and calculation point indicators form an overall indicator system, and equipment monitoring and failure warning must be implemented around them.
3.2, model management function
The model management function is mainly used to maintain a series of performance parameters (such as design parameters, characteristic parameters and related parameters) of the equipment and the upper and lower limits of the parameter alarms. According to these parameters and limits, the system realizes the parameters by real-time monitoring of the parameter values. Traditional fault threshold alarms.
Another main function of the model management module is to associate similar related devices and establish relationships between devices. Similar equipment refers to parallel equipment with similar operating environment and mode; related equipment refers to equipment that affects the health of equipment during the operation of the unit. The similarity and related equipment association is beneficial to the comparison between the user's operation status between the devices in the real-time monitoring process and the abnormal data between the devices after the fault alarm. Because the system failure warning is not only for a single measurement point, but can be based on the knowledge of the expert library, combined with real-time data of multiple measurement points to comprehensively determine whether a device has a fault, so when the user finds that a device has an alarm, Through the layer-by-layer expansion, you can view the real-time data of multiple related measuring points to determine the root cause of the problem.
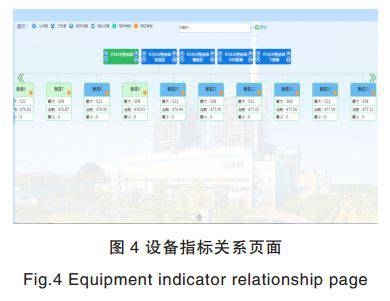
The device information and the relationship between the indicator information, performance parameters, and device maintenance maintained by the model management module are displayed on the device indicator relationship page (see Figure 4), which is convenient for monitoring the running status of the device.
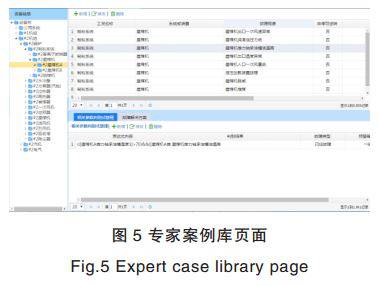
3.3. Provide expert case library function
The expert case library is a fault and early warning model for the formation of equipment by business experts through the accumulation of knowledge and experience. In the early stage of system development, a large number of data on power plant failures were collected, and based on expert expertise, accident case analysis and accumulated experience of professional engineers and maintenance personnel in daily work practices, a combination of theory and experience was combined to summarize a typical fault model. (including failure signs, analysis, solutions, etc.). Through the analysis of typical fault models and the quantification of formulas, the expert's knowledge, accident case analysis conclusions and fault judgments of professional engineers and maintenance personnel are quantified into a series of clear warning criteria such as data and calculation formulas (such as horizontal indicators). Mutual relationship, time-long vertical index changes, etc.), establish a complete early warning mechanism, and carry out repeated verification in the operation of power plant equipment, and continuously learn from experience to optimize and improve. The expert case library (see Figure 5) consisting of a typical fault model and its corresponding early warning criteria is the cornerstone of the system's successful early warning.
3.4. Equipment monitoring function
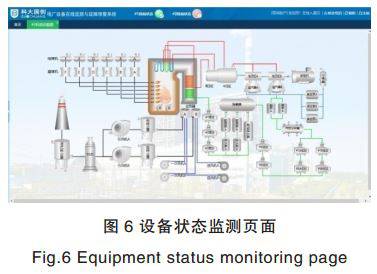
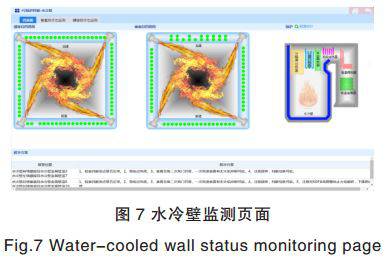
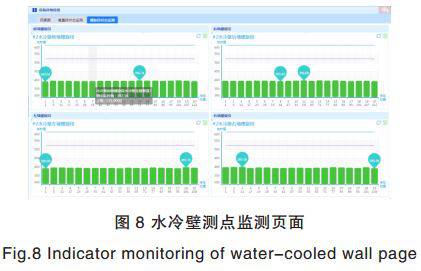
In addition to providing the plant's traditional configuration map monitoring screen, the system also provides a more intuitive device status monitoring screen (see Figure 6). The status monitoring page shows the process flow of the generator set with SVG graphic technology, and can customize the monitoring page for the main equipment of the generator set. All devices can click the device icon to pop up its real-time monitoring page to check the running status. Figure 7 and Figure 8 are respectively water-cooled. Wall real-time monitoring page and water wall monitoring point monitoring page.
3.5, fault warning function
The system uses the real-time data technology independently developed by the enterprise to store the automatically collected real-time data, and then calculates and analyzes the fault early warning criteria established in the system knowledge base module in the previous period to determine whether the early warning criterion is established, and The results are sent to the system web server quickly, efficiently, and securely. The web server then pushes the warning information to the status monitoring page of the system foreground and the mobile client of the relevant maintenance personnel in real time.
When the warning system issues a warning, the user can not only see the information corresponding to the device that issued the warning, but also check which points of the device may be faulty through the relationship tree, and check whether the device with the warning affects the device through the related device. Whether the operation or warning to its downstream device is caused by some abnormality of its upstream device, so as to find the source of the problem more intuitively and quickly.
When a device sends an alarm, the system displays the relevant indicator parameters of the device problem that may be affected by the trend graph group on the same interface, and analyzes and compares the related device operating conditions of the device. The related technicians have facilitated the work of viewing, analyzing and judging, which not only facilitates comprehensive analysis of problems, but also greatly improves work efficiency and reduces economic losses. At the same time, the system will issue a processing request for the possible failure of the device, generate a defect processing list, and track and analyze the processing process, response time and processing result.
3.6, maintenance decision function
After the failure and early warning occur, under the premise of ensuring the safe operation of the equipment, the equipment is analyzed for life, and the management information such as maintenance cost and energy saving benefit is integrated, and the equipment leader is provided with equipment maintenance and replacement scheme for technical and economic analysis, and maintenance assistance decision is provided. And according to the typical fault model in the expert case library, provide specific countermeasures and treatment suggestions, guide the operation personnel to adjust and handle the operation, so as to effectively eliminate the fault and ensure the economic and safe operation of the unit equipment.
4, the conclusion
Adapting to the development needs of the domestic power industry and realizing the predictive maintenance of equipment is an inevitable trend in the reform and development of power equipment maintenance. The system performs real-time status monitoring on the performance parameters of the unit equipment, automatically extracts information reflecting the fault characteristics of the equipment, uses the fault diagnosis model to identify the health status of the equipment, and gives recommendations for the most likely cause of the equipment failure, and solves the problem of the generator set equipment. It has a good guiding significance and provides strong support for the optimization of unit equipment maintenance.
The research of this system mainly focuses on the prediction part of equipment operation status. At present, the early warning criterion for implementing early warning is a rule for human analysis and summary, and its accuracy needs to be repeatedly verified and optimized in practice. Constantly improving, optimizing and enriching the library of expert cases is the future direction of the system. Since the research on fault early warning system of power generation equipment is an emerging topic at home and abroad, there is still a long way to go in application promotion.
Type1 Tethered Cable,16A Type1 Tethered Cable,32A Type1 Tethered Cable,Type 1 Tethered Charging Cable
Yangzhou JERI New Energy Co., Ltd. , https://www.jrevcharging.com